).png)
Nifty !! Exactly what is the trend !!!
What to do with Nifty! Is it a bottom-out or something else !!
It has been observed since April 2022 the nifty index started a downwards trend and made lower highs. As per price action, the Nifty is making lower highs and lower lows in the daily chart.
It is not clear from the chart whether the trend is bullish or bearish.
If bearish then is it bottom out or continuous trend or bullish reversal has already happened.
It is hard to get this information only from Price action.
I have done extensive analysis on time series data of nifty future where I have considered raw data points which is much higher than considered in any ready-made indicators. I have considered 2 variables with long-term and short-term mean and created deviation. Later, using advanced statistical tools the standardization of the data helped me to compare and consider the India VIX with this deviated data.
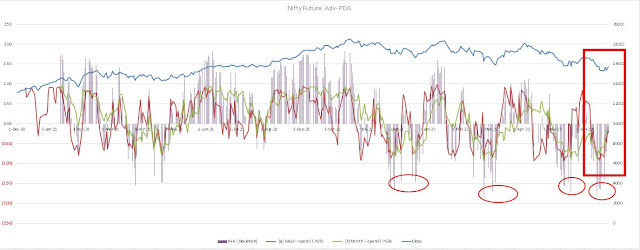
The 2nd chart shows Nifty Fut. Adv. PDA. It is a daily chart where the blue line shows the Nifty fut, the Green line is the long-term mean deviation, the Maroon line shows the short-term mean deviation and the purple bars indicate the sum deviation of long and short.
Findings: The chart shows that the Green and Maroon lines oscillate between 2 to -2 along with the Purple bars ( Sum deviations).
This Chat forecasts the bullishness if both the Green and Maroon lines are above the 0 lines and the depth of the same will depend on the degree of the Purple bars.
Current Status: Nifty fut PDA chart shows both the Green and Maroon lines are near zero line and the Purple deviation bars are in the declining mode of negative deviation. This shows a bullish reversal zone but is not a confirmed one.
Now, for confirmation, we need to get the price action to act on the same. As of now on the daily chart ( Chart 1), the price is standing just on an important resistance.
In Chart 3 I have considered India VIX and the deep deviation of the long and short-term means. I have tried to standardize these data with some advanced statistical tools.
Once again I have created a daily chart where the Green line Stranderdise VIX line and Maroon Deviation bar are oscillating between 0.30 to -0.30.
If the Green Line stays above 0 lines and the Maroon bar is also above the 0 lines then the probability of the Nifty fut is high to be Bearish and vice versa.
Once again if the Green line and the Marron bars oppose then could be sideways and probable a TRAP for the traders.
I have tried to analyze and get the maximum out of the data points which not visible unless deep mining. Price action is one of the predictive tools but Statistical tools also can help you find out more.
Now, After analyzing all the charts above It is clear that the data is showing a Bear Trap. Even though the market is going upward but data is not supporting that, meaning there is Sell on Rising is happening. So trade cautiously.

).png)
.png)


0 Comments: