
PDA and Strategy for trading and Investments
PDA and Strategy for trading and Investments

I was backtesting the last 5 years' Nifty Data to find the relations between maximum longer data points. This is a deep data analysis where the deviations to long and short data are only considered. As this is a deep deviational analysis of price movement I call this "Price Deviation Analysis"(PDA).
PDA clearly defines the direction of the market whether Bullish, Bearish, or Sideway. This works as an oscillator where 0 is the midline to decide the phase. Above the 0 lines are a positive phase and vice versa. The histogram of the deviation can get charted like RSI or MaCD but much more effective due to much higher data points.
Though this is an analysis only, one can easily derive strategies from this analysis. I have back-tested the only BUY strategy in all classes of scripts with defined volume ( above 500000 ) and market capital ( above 300 cr. )

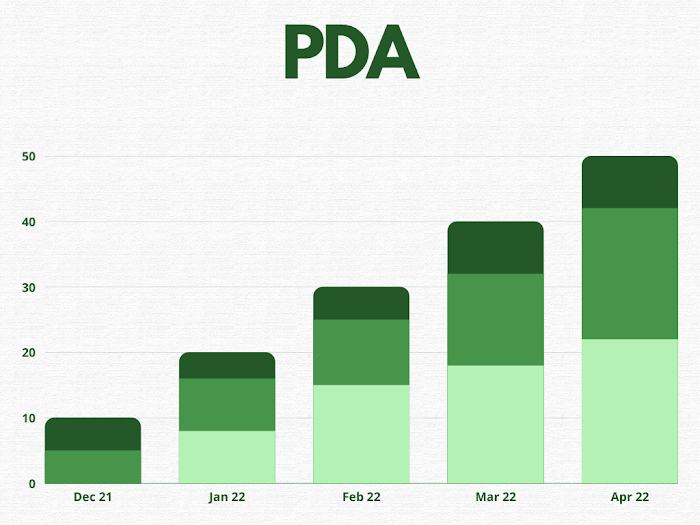
The above table is showing the real-time backtested results on the Daily closing of the Nifty 50 index.
We can observe the increase in positive deviation results in the increase in price also and vice-versa.
Now, the strategy time. I have created only a "BUY strategy ".

It is clear from the above table that one can easily create a strategy from the deviations. Please note these decision data are recently derived from the Analysis.
As per nifty 50, 5 years data backtested result with PDA and only BUY strategy is as follows...
.png)

0 Comments: