What to do with the index future !!
Nifty Dynamic mean Deviation Analysis
Mean Deviation analysis plays a great role to identify the trend of a high-volume market. The deviation analysis works like oscillators that move between +1 to -1 where 0 is the neutral line. I have tasted statistically as many data points in this analysis and presented a medium-term analysis of Nifty future, which may give you an idea of how one can forecast the market only through this analysis.
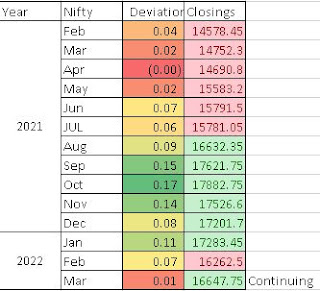
The above data shows the monthly continuous deviation and the closing since Feb 2021. In the deviation column, dark red is the most negative, and dark green is the most positive oscillation whereas in the Closing column red and green are below and above-average to date.
So, without any readymade plotting software or brokers charting platform we can easily spell out whether in medium-longer-term the indexes movement.
let's plot the above data.
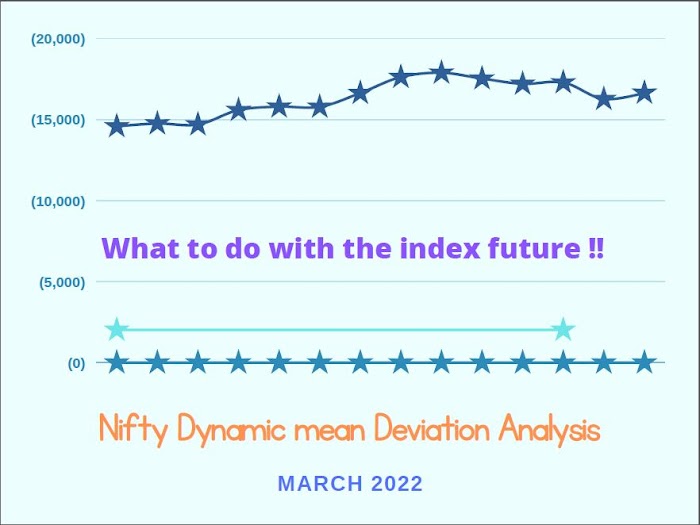
The above data is self-explanatory. I have plotted The Nifty Future and the Dynamic deviation data both in the same chart. Where the increment of the deviation above the 0 lines is a positive outlook for the medium-longer-term. We can see that whosoever invested after May '21 in Nifty future has seen approximately 12000 points run. The Oscillator is also very smart to show you when to exit much before the price action indicates.
This oscillator cannot be comparable with MACD ( Moving average convergence and Divergence ) because the longer-term moving average is a dynamic one and the average of the shorter-term moving averages.
As per the above data, the Nifty future has not entered yet into the Bear zone as the deviation is not crossed the 0 lines yet . Deviation till date being above the average deviation i.e. -0.07 level in the oscillator.
Conclusion: As per the above data we can conclude the index future is in a correction mode of the bull phase.
For more information and deep analysis, you can follow my telegram Click Here to JoinClick here


0 Comments: